In short:
- Pittsburgh’s metro price index was higher in Q2 2026 than a year earlier, while the metro median listing price fell from June to September 2026. They measure different things, so they don’t contradict each other.
- Both cover the whole metro area, so neither can tell you what’s happening on your block or to your house.
- This week, check the source pages on Thursday, Nov. 12, then take one 20-minute walk down your own street with three questions in hand.
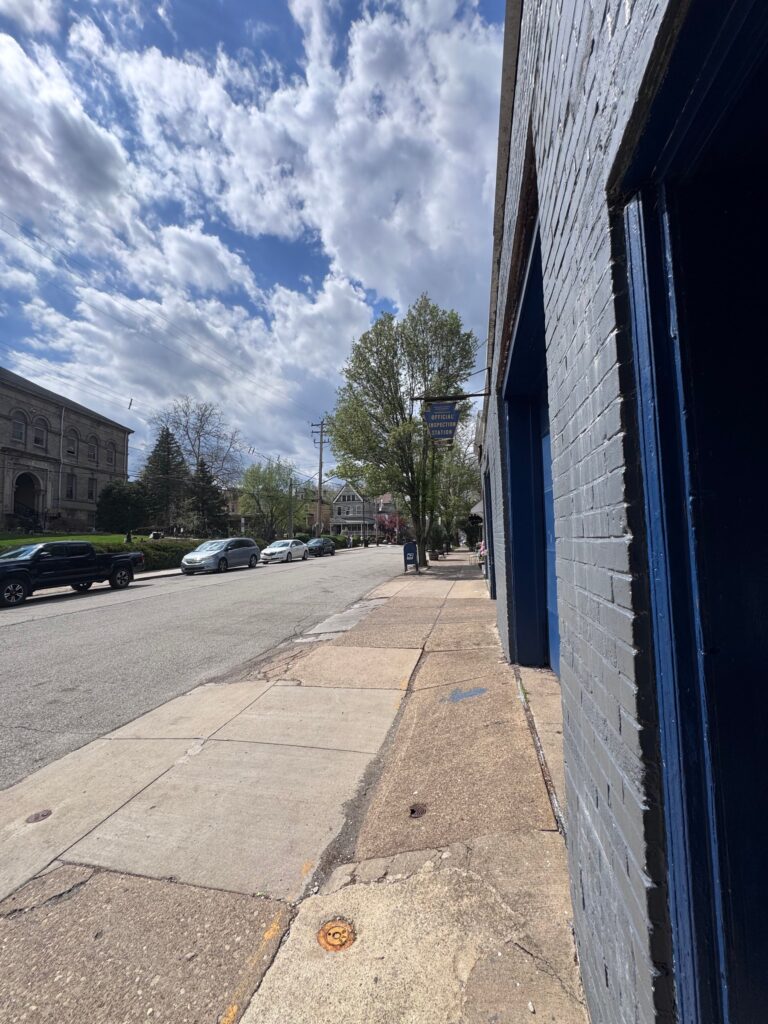
Stand at the corner of Penn and Shady avenues and you can see a project that doesn’t exist in any price index yet. On June 30, the Pittsburgh Planning Commission approved a six-story apartment and office building there, part of the Bakery Square expansion, according to 90.5 WESA. Final construction plans still need approval from the city’s zoning administrator.
That’s one corner. Every East End block has its own version: a project down the road, a parking rule only the neighbors know, a boiler older than the last three owners. A price number for the whole Pittsburgh area doesn’t see any of that.
Still, people keep running into those numbers, and the headlines don’t agree. Here’s what two widely used ones measure, in plain words, with the period for each.
Number one: the price index (higher than a year ago)
The Federal Housing Finance Agency publishes an All-Transactions House Price Index for the Pittsburgh metro area. In its Aug. 25, 2026 release, shown on ALFRED, the latest reading was 335.98 for Q2 2026. It’s quarterly, it isn’t seasonally adjusted, and it’s set so that Q1 1995 equals 100. The number isn’t a dollar amount. What matters is how it moves from one quarter to the next.
Because it isn’t seasonally adjusted, the cleanest comparison is the same quarter a year apart. The FRED series page (ATNHPIUS38300Q), last updated May 26, 2026, shows:
- Q1 2025: 316.95
- Q2 2025: 325.51
- Q3 2025: 326.60
- Q4 2025: 327.43
- Q1 2026: 333.31
Q1 2026 is about 5% above Q1 2025 (316.95 to 333.31, our arithmetic). Q2 2026 from the August release is about 3% above Q2 2025 (335.98 against 325.51, also our arithmetic). One caution: those two figures come from different releases, and values can be revised between them. Check the newest release before you quote a figure.
Number two: the median listing price (lower since June)
Realtor.com data on FRED puts the median listing price in the Pittsburgh metro at:
- June 2026: $259,900
- July 2026: $257,900
- August 2026: $249,900
- September 2026: $245,000
That’s $14,900 lower in September than in June, about 5.7% (our arithmetic). But these are asking prices on homes for sale in those months. They aren’t what anyone paid. A median is the middle of whatever is listed, so it can move when the mix of homes changes, not only when prices do. If more smaller homes come on the market in one month, the median can slip even if no individual house got cheaper.
The FRED page was updated Oct. 1 and listed Nov. 5 as the next release, so a newer month may already be posted.
How both can be true
One number compares a quarter with the same quarter a year earlier. The other follows asking prices over a few summer and fall months. They cover different homes, different moments and different questions. The index asks how prices have moved over time. The listing median asks what sellers are asking right now across everything for sale.
Neither is a forecast, and we aren’t making one. They describe where things have been.
The national figure is a third measure. NAR reported that the national median existing-home price was $417,500 in September 2026, up 1.3% from a year earlier. That’s closed sales across the whole country, so it doesn’t line up against Pittsburgh’s $245,000 listing median.
What a metro-wide number can’t tell you about one street
The Pittsburgh metro is far larger than the five neighborhoods we cover: Point Breeze, Squirrel Hill, Shadyside, East Liberty and Lawrenceville. A metro figure blends all of it. What gets lost:
- The house itself. An older house with an updated boiler and a dry basement sits in a different place than a neighbor’s with original clay sewer lines and old wiring.
- The block. Parking, the walk to the bus, a corner like Penn and Shady that may change as projects move ahead. You can only judge these on foot.
- The carrying costs. Property taxes depend on your municipality and your assessment. Heating an older house through a Pittsburgh winter is a real cost too, and no index counts it.
- The sample size. On one street, a few sales in a year can look very different from the metro trend. Small numbers swing.
What to do this week
- Thursday, Nov. 12, 10:00 a.m. Eastern: NAR posts its October figures on its Existing-Home Sales page. Open it alongside the two FRED pages above and ask three questions of each number: what period, what is being counted, and what geography.
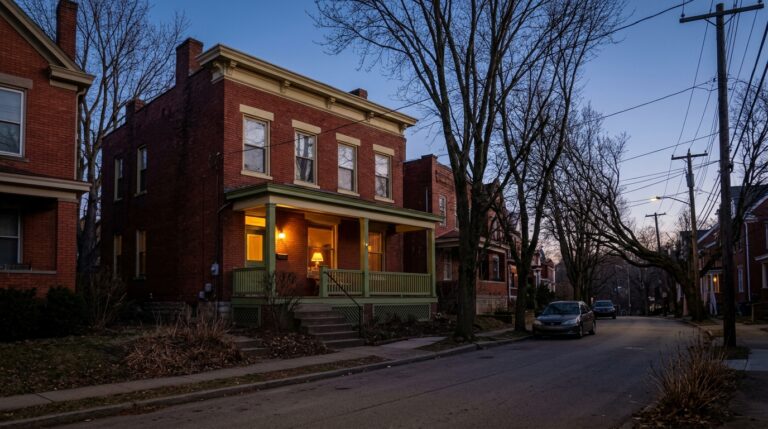
- Before the weekend: walk your own block for 20 minutes, ideally around 6:30 p.m. when it’s dark and people are home. Write down where you’d park, which sidewalk slabs are lifted, and anything posted nearby about a project.
- Keep the notes. A page of what you saw on your street tells you more about your block than any metro-wide number does. If you’re comparing blocks, do the same walk on each.
If you’re thinking about buying or selling, these numbers are background and nothing more. For your own situation, talk to a licensed real estate professional.
If you own an East End house and you’d like to see how your block and your house look next to all this, Mike offers a free home evaluation. It’s a conversation, and you can take the walk first.
Howard Hanna
Squirrel Hill Office, PA
6310 Forbes Avenue
Pittsburgh, PA 15217
(412) 421-9120
Keep reading: Selling an East End House This Winter, When Buyers Have Choices